The Livermore-led VisIt visualization and analysis tool has supported scalable, high-quality evaluation of simulation results for over 20 years.
Science and Technology Highlights
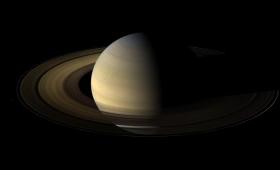
Scientists have revealed experimental evidence that helium rain is possible over a range of pressure and temperature conditions expected to occur inside Jupiter and Saturn.
With a number of Department of Energy incentives and funding streams, Lawrence Livermore’s research commercialization efforts are changing the world and paving the way for technology’s next big thing.
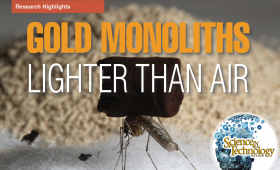
Laboratory researchers have produced and refined the lowest-density gold foam aerogel ever made—a significant breakthrough in nanoscale materials engineering.
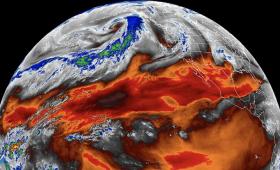
New research shows that satellite measurements of the temperature of the troposphere may have underestimated global warming over the last 40 years.
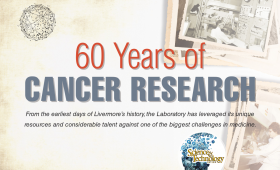
From studying radioactive isotope effects to better understanding cancer metastasis, the Laboratory’s relationship with cancer research endures some 60 years after it began.
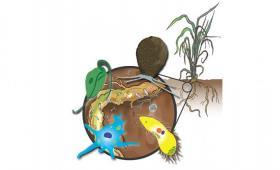
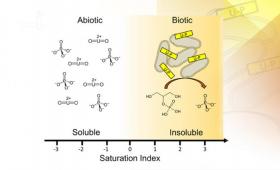
Researchers study protist–plant relationships to understand the role of protists in the rhizosphere.
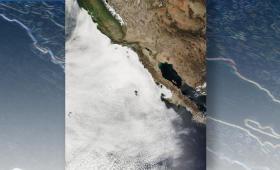
Global warming causes low-level clouds over the oceans to decrease, leading to further warming.
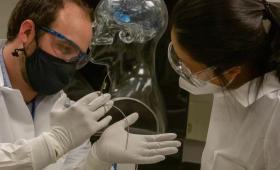
Thin-film electrodes developed at Lawrence Livermore have been used in human patients at the University of California, San Francisco, generating never-before-seen recordings of brain activity in the hippocampus.